Sales Analysis
Dashboard
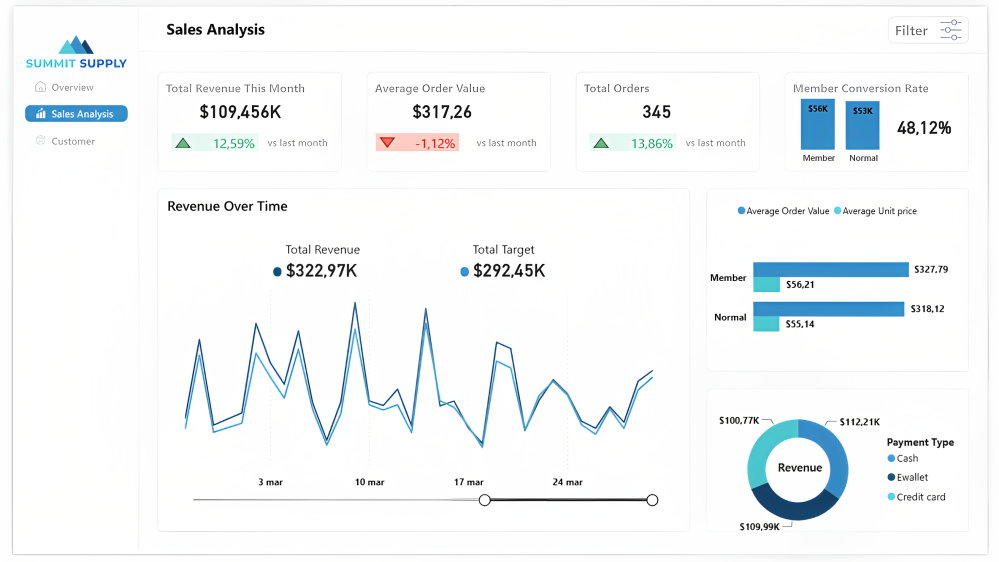
This Power BI dashboard was designed to give Summit Supply a clear, real-time view of sales performance. The goal was to turn fragmented sales data into a cohesive, interactive analytics experience.

Interactivity
Hidden Filter Pane with Blurred Background effect.
This allows users to drill into specific customer groups, compare branch performance, or analyze revenue by product line with a single click, without cluttering the visual layout.
Conditional Formatting
Values turn green for positive MoM growth and red when performance declines. This ensures the user can interpret March vs. previous-month results instantly, without deeper navigation.

Business Challenge

Summit Supply needed a single, consolidated view to understand how the business performed during March. Before this dashboard, revenue insights, order volume, and customer performance were scattered across multiple reports and spreadsheets. Leadership lacked the visibility required to track month-over-month changes, evaluate the membership program, or understand payment preferences.
Data Used
The dashboard was built using sales data from the Summit Supply’s internal system.
Key fields included: Date, Customer Type, Branch, Gender, Payment Method, Product Line, Gross Income, Gross Margin%.
Visualisations
- KPI Cards: Total Revenue (March), Average Order Value, Total Orders, Member Conversion Rate
- Line Chart: Revenue Over Time for March vs. target
- Bar Charts: AOV and Average Unit Price comparison (Member vs. Normal Customers)
- Donut Chart: Revenue distribution by Payment Type (Cash, E-wallet, Credit Card)
- Interactive Slicers: Branch, Product Line, Payment, Gender (inside hidden pane)
Key Measures (DAX)
- Total Revenue
- March 2024 Revenue
- February 2024 Revenue
- Average Order Value
- Total Orders
- Member Conversion Rate
- Revenue MoM Change %
- AOV MoM Change %
- Total Orders MoM %
Insights
- March revenue reached $109.5K, representing a strong 12.59% increase vs. February.
- Total Orders rose by 13.86%, confirming higher customer traffic.
- Average Order Value dipped by 1.12%, suggesting customers bought more frequently but at slightly lower values per order.
- Members generated higher AOV and higher average unit price than non-members, reinforcing the value of the membership program.
- Payment patterns show Credit Card and E-Wallet dominating, offering insight into customer preferences and potential partnership opportunities.
